Investigation 2
Part 3
Hypothesis
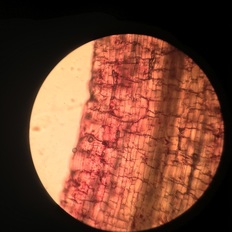
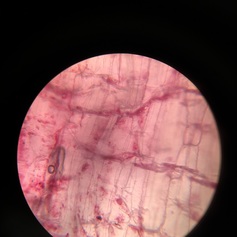
If you pay attention to your onion root tip under the microscope then you will be able to identify the processes of mitosis.
Procedures
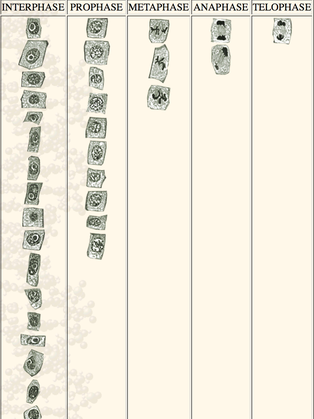
1. You will begin this lab by pressing the link that is provided in you Blab Requirements document that can be found in Google Classroom (Time Spent in the Phases of Mitosis)
2. Then you may begin to click on each phase and make sure the images are all located into the CORRECT phase.
3. Once you have completed placing each image into the correct phase you must begin to count how many cells are identified in each phase.
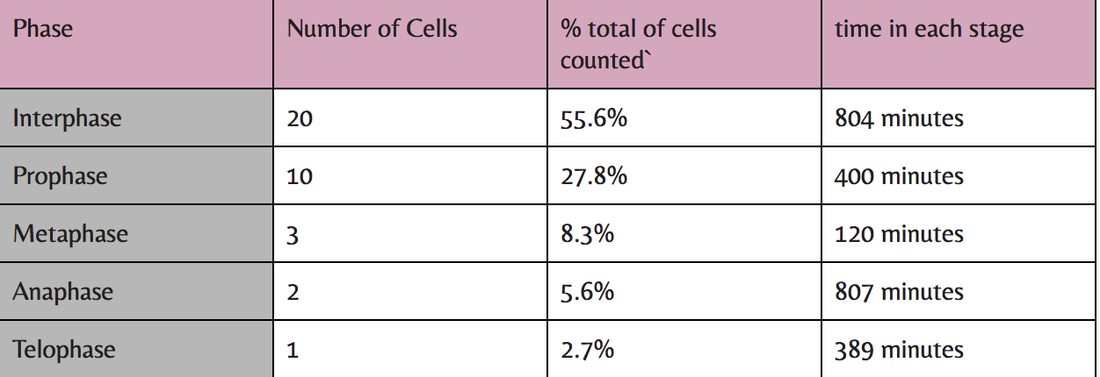
3. Then you must find the percentage total of each phase.
4. Be sure to keep track of your data on your chart (the chart that I have completed is provided below *may be used as an example*)
5. Your last calculation will be finding the time in each stage by multiplying your percentage of total cells counted by 1440 (mark time in minutes)
6. Proceed to enter your data into your chart.
7. Take screenshots of your phases on the website and your chart as extra data.
8. Once that is completed you may exit out of the website if it is no longer needed and you may proceed to your conclusion.
Images
Analysis
To calculate the amount of time spent in each phase of the cell cycle from the percentage of cells in that stage. On the average, it take 1,440 minutes (24 hours) for onion root tip cells to complete the cell cycle. % of cells in stage x 1440 minutes = _____ minutes of cell cycle spent in stage.
Conclusion
Unfortunately, my conclusion isn't what I expected. I was able to identify all of the phases of mitosis through my slides containing the onion root tip. Therefore, my hypothesis was incorrect; but you are able to identify more information about these phases in the chart provided above. This chart can allow us to receive a better perspective on how these phases worked.
